According to the educational DEformers who have seldom (or ever) tried to teach in an inner-city or rural poverty-stricken, segregated school, all one needs to do in order to ‘smash’ the ‘achievement gap’ is to fire all the veteran, unionized teachers and hire new and inexperienced but somehow ‘excellent’ college grads, close the old ‘failing’ schools, and all will be peaches and cream and light and wonderfulness.
In DC, nearly half of all students now attend charter schools.
Many of those schools remain completely segregated both by class and by race, as I have shown, just as many of the regular public schools were (and are).
Well, how do these new charter schools do?
Actually, not very much better. Certainly the millennium has not come.
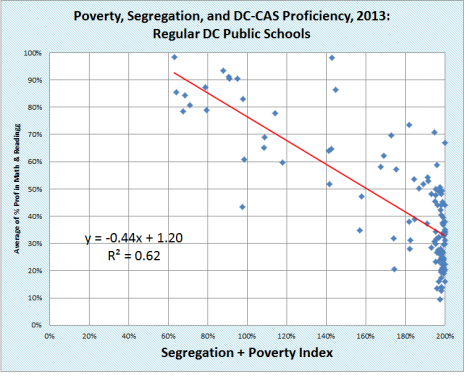
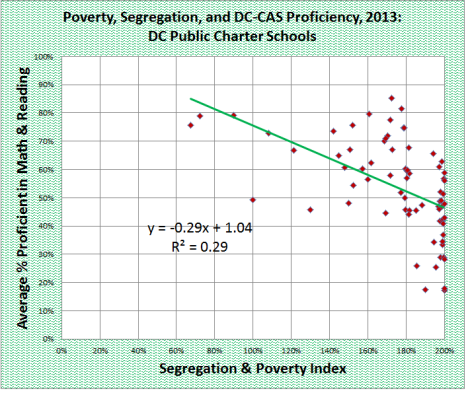
I present to you three graphs that I made using the stats released by DC’s Office of the State Superintendent of Education. On the x-axis, I added the rate of poverty and the rate of segregation to produce an index that goes from 0 percent (impossibly un-segregated with 100 or more equally-represented ethnic groups and no kids on free and reduced-price lunch) to 200 percent (which means 100 percent black and/or hispanic and 100 percent eligible for free or reduced-price lunch).
On the y-axis I graphed the average of the ‘pass’ rates in math and reading.
You will see that an enormous number of schools line up on the far right-hand edge of the graph. Those are the high-poverty, highly segregated schools. Only a very small fraction of schools (both regular public and charter) are anything else.
This graph is for ALL publicly-funded schools, both regular and charter:
Notice that the linear correlation between segregation & poverty on the one hand, and average achievement on the other, is fairly strong and negative. R-squared is 0.49, which means that the correlation coefficient R is about 0.7.
Next, let’s look at just the DC public schools:
You will notice that the correlation is a bit higher: R-squared is 0.62, which means that R itself is nearly 0.8. Most of the high-poverty and high-segregation schools have proficiency rates between 10 percent and 55 percent.
And now let’s look at the same graph for the DC charter schools:
To their credit, the charter schools do appear to have a weaker correlation between my poverty&segregation index and test scores. R-squared is about 0.29, which means that R is a bit more than 0.5.
Do the charter schools seem to have some magic bullet, so that all of the schools with segregation and poverty indices of 190 percent or more are all scoring at the top of the charts? No way. The cluster of schools at the far right-hand end of this graph still score fairly low: between 18 percent and 65 percent, instead of between 10 percent and 55 percent.
Of course, we don’t exactly know how that happens. A difference that small can easily be obtained by rejecting incomplete applications and pushing out certain students.
You also can see that there are essentially no charter schools with average proficiency rates over 85 percent, but there are ten such regular public schools.
Read more from Public School Shakedown and Guy Brandenburg.


